AIM357 - Build an ETL pipeline to analyze customer data
Machine learning involves more than just training models; you need to source and prepare data, engineer features, select algorithms, train and tune models, and then deploy those models and monitor their performance in production. Learn how to set up an ETL pipeline to analyze customer data using Amazon SageMaker, AWS Glue, and AWS Step Functions.
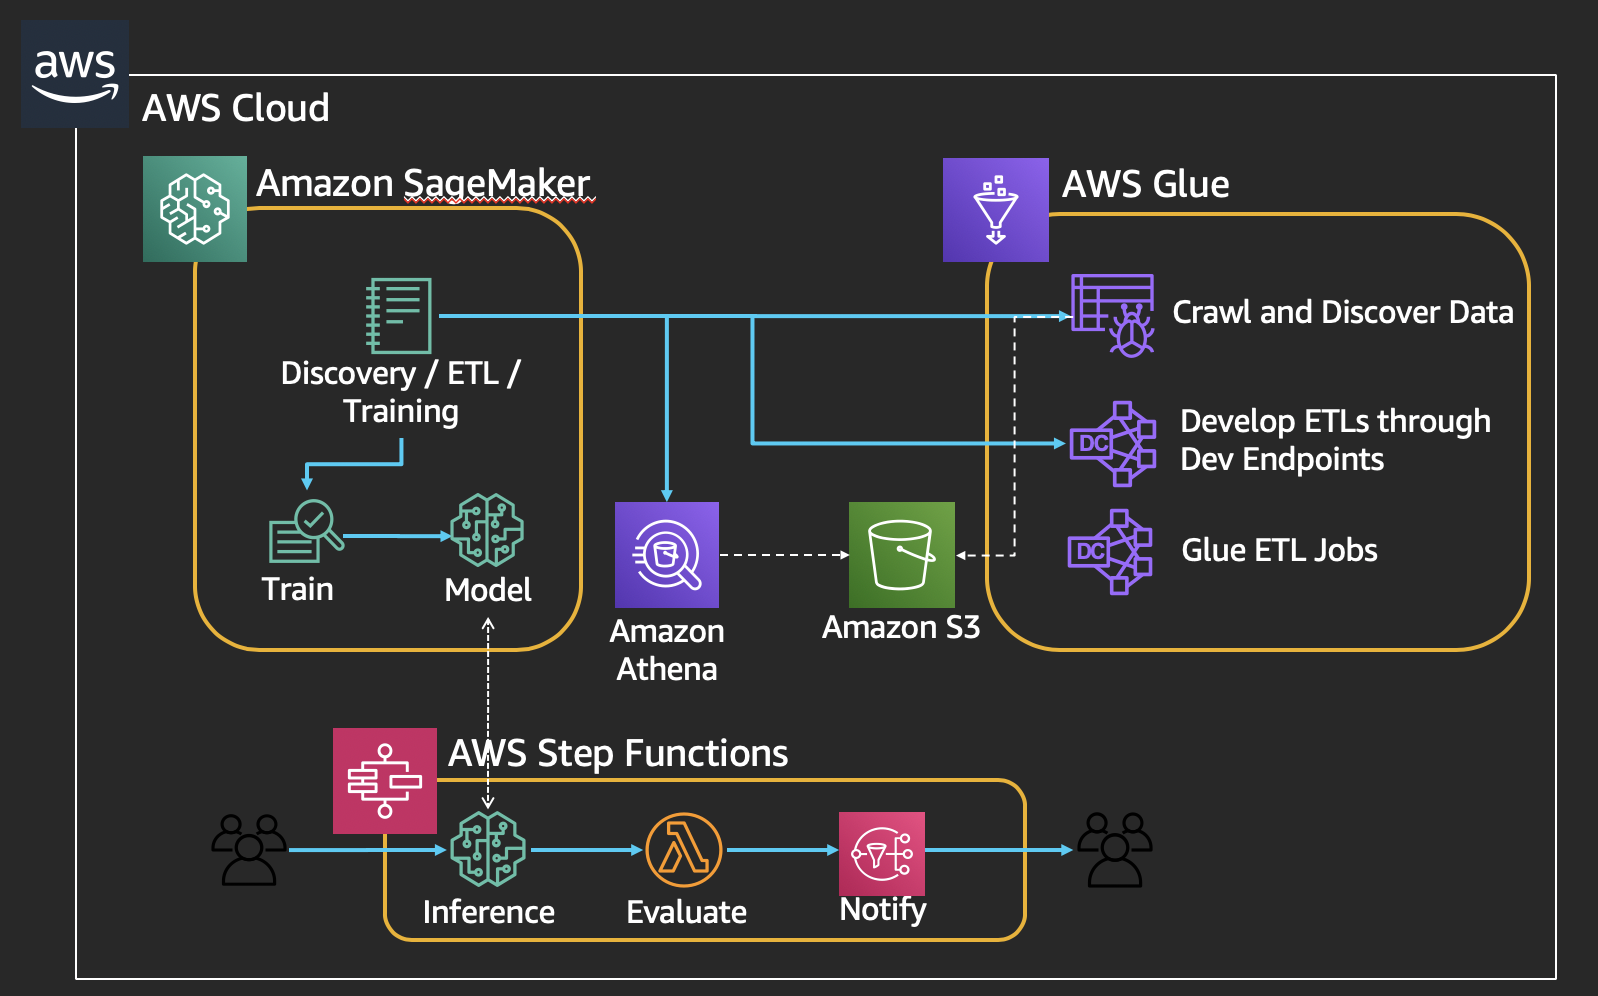
This workshop will be around the ETL and full pipeline to perofrm Time-series forecasting using NYC Taxi Dataset. It includes the following steps:
- Crawl, Discover, and Explore the new datasets in a Data lake
- Perform Extract, Transform, Load (ETL) jobs to clean the data
- Train a Machine Learning model and run inference
- Assess the response
- Send an alert if value is outside specified range
The workshop uses the following architecture:
Steps for launching the workshop environment using EVENT ENGINE
Enter a 12-character “hash” provided to you by workshop organizer.
Click on “Accpet Terms & Login”

Click on “AWS Console”

Please, log off from any other AWS accounts you are currently logged into
Click on “Open AWS Console”

You should see a screen like this.
Notebooks
- Data Discover and Transformation
- What are Databases and Tables in Glue:
- Waiting for the Crawler to finish
- Let’s wait for the next crawler to finish, this will discover the normalized dataset.
- Note, we are querying the transformed data.
- Wait to discover the fhvhv dataset…
- That looks better – let’s start looking at performing EDA now. Please open the other notebook file in your SageMaker notebook instance.
- Feature Engineering and Training our Model
- Reading the Data using the Catalog
- Creating our time series (from individual records)
- Local Data Manipulation
- Cleaning our Time Series
- Visualizing all the time series data
- But now we need to combine the FHV and FHVHV dataset
- DeepAR Deep Dive
- Deploying a realtime predictor
- Running Predictions on the Endpoint
- We’ll show you in the next notebook, how to recreate the predictor and evaluate the results more.
- Examine notebook used to visualize results
- Running the Step Functions inference workflow